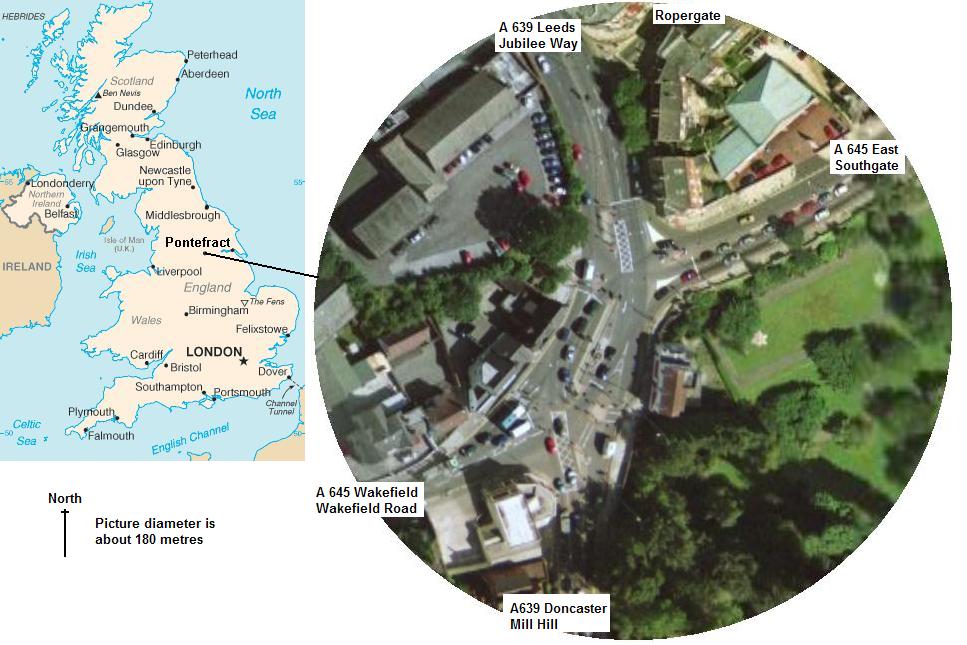
 Fig 1: Town End Junction, Pontefract
A massive burden to society
Last Update: 30th January 2007
A companion piece to this report is updated as Town End Diary
First produced in April 2000
Pontefract is a town of about 32,000 inhabitants on the eastern edge of industrial West Yorkshire (and the western edge of agricultural East Yorkshire). On the south-western edge of the town centre, the two main roads, the A 645 (East-West) and A 639 (North-South) cross, at 'Town End' (fig 1). Between about the 29th October and Christmas 1996 the intersection of these roads was re-structured, when a pair of roundabouts and zebra crossings were removed and replaced by a system of traffic lights and pelican crossings.
The installation of the lights created some disquiet amongst those who pass through them. In 2000 the author published a report illustrating an increase in accidents both at the site and in Pontefract in general since the installation of the lights. It takes longer, as a pedestrian and drive, to cross the junction. Many people now drive on routes which circumvent this particular junction.
As of 2006 the arrangements remain in place, their installation being justified by the local authority, who would not be interviewed on local radio, but issued the statement
"The junction is now safer. Prior to 1996 there was an average of just over five accidents per year. In 1997 their were four, in 1998 eight and in 1999 five"
(work it out).
Fig 1: Town End Junction, Pontefract
There has not been a reduction in traffic casualties in Pontefract, and the rise has been greater than the national trend.
The original research arrived at the following:
|
The data available ran from 1992 to 1999.
Four sets of data were compared. The year of 1996 was discarded, as for three months of this year the road works at Town End may have effected numbers. For local statistics the three years before 1996 were compared with the three years after 1996. These figures gave the greatest possible sample available while retaining a balance on either side of 1996. For the same reasons, only two years of national statistics either side but not including 1996 were taken into account, as the figures for 1999 are not available yet. The National statistical group is so large it can be regarded as a more reliable indicator than the local one, nevertheless, as soon as the national figures for 1999 become available they will be used.
We can observe that there has been no decrease in casualties in Pontefract, that the increase in slight casualties exceeds the national average, and that the increase in serious casualties bucks the national trend of reduction by a considerable amount. | ||||||||||||||||||||||||||||||||
Subsequently the following figures have been recorded for national and local accidents:
Table 1(a): Comparison of Road Casualty rates, Pontefract:Great Britain 1992 -2004
| | Total Casualties | Comparison, expressed as | percentage of 1992 rates Year | G.B. | (1000's) Pont. | GB | Pont. | Pontefract | excess 1992 | 311 | 115 | 100 | 100 | 0.00%
| 1993 | 306 | 131 | 98.5 | 113.91 | 15.65%
| 1994 | 315 | 113 | 101.39 | 98.26 | -3.09%
| 1995 | 311 | 114 | 99.95 | 99.13 | -0.82%
| 1996 | 321 | 127 | 103.32 | 110.43 | 6.88%
| 1997 | 328 | 132 | 105.58 | 114.78 | 8.72%
| 1998 | 325 | 121 | 104.61 | 105.22 | 0.58%
| 1999 | 320 | 123 | 103 | 106.96 | 3.84%
| 2000 | 320 | 115 | 103 | 100 | -2.91%
| 2001 | 313 | 120 | 100.75 | 104.35 | 3.57%
| 2002 | 303 | 136 | 97.53 | 118.26 | 21.26%
| 2003 | 291 | 122 | 93.67 | 106.09 | 13.26%
| 2004 | 281 | 143 | 90.45 | 124.35 | 37.48%
| | ||||||||
It can be seen that although prior to 1996 Pontefract did not appear to behave differently in terms of casualties than the national trends, and although 1993 was relatively bad (For Pontefract), the other three years considered all enjoyed an casualty rate less than might be expected taking the national average as a guide and taken as a whole these four years did not appear extraordinary. Subsequent to and including 1996, there has only been one year when there have been fewer casualties in Pontefract than might be expected given the national trends. Between 1997 and 2004 the total casualty rate in Pontefract has exceeded the national trend by 7%. Pontefract appears to have become more dangerous as time has worn on. This serves to reinforce the original conclusion "that there has been no decrease in casualties in Pontefract"
There has not been a reduction of casualties at Town End
| Year | Casualties | Average
| 1992 | 8 | 6.25
| 1993 | 8
| 1994 | 5
| 1995 | 4
| 1996 | N.A.
| 1997 | 8 | 10
| 1998 | 11
| 1999 | 11
|
Table 3: Annual traffic casualties at Town End
| | ||||
The financial implications of casualties are outlined below. Using government estimates, we can calculate that at Town End casualties before 1996 ran at a cost of approximately:
24 (Slight casualties) times �10,000 plus 1(serious casualties) times �100,000 all divided by 4 = �85,000 per year
After 1996 we can see an average of:
30/3 = 10 per year At a cost of 28 times �10,000 plus 2 times �100,000 all divided by three = �160,000 per year
Huge
The original research arrived at the following:
|
A death on the roads has been priced at slightly over �1,000,000 (Source DETR 'Road accidents Great Britain: 1997 the casualty report': 28-33) A non-fatal serious injury is slightly over �100,000. If national trends were reflected locally we might have expected the following approximate costs of KSI traffic casualties in Pontefract for the period 1997-1999 �100,000 per each of the 34 non-fatal serious injury x 91% �100,000 x 34 x 91/100 = �3,094,000 The approximate costs of KSI traffic casualties in Pontefract for the period 1997-1999 were �100,000 per each of the 42 non-fatal serious injuries plus �1,000,000 for each of the two deaths. (�100,000 x 42)+(�1,000,000 x 2) = �6,200,000. We might expect a cost of �3,094,000 We, in fact, have a cost of �6,200,000 Traffic casualties in the last three years have exceeded expectations by over three million pounds. Even if the two fatalities are ignored, there is still over �1 million excess on what might be expected. Bearing in mind that there has not been a multiple death in any one incident, an expensive trend seems to be indicated. |
Bringing the figures up to date, the DfT use the following:
| Fatal | �1,384,463 |
| Serious | �155,563 |
| Slight | �11,991 |
| "Average value of prevention per casualty by severity"(2004). | |
|---|---|
Using these figures we can calculate that casualty costs (for instance, per year) nationally have dropped by 13.36% from the four years before 1996 to the 9 years after 1996. In Pontefract casualty costs for the same periods have risen by over 45%. Pontefract's average casualty cost per annum since 1996 has been about �4,555,243; if Pontefract had mirrored national trends and had a 13.36% reduction, we might expect an annual casualty cost of of �2,721,056. If we are to quantify costs this way, we see that
Pontefract, since 1996, now has a yearly excess casualty cost of �1,834,187.
This serves to reinforce the original conclusion "an expensive trend seems to be indicated".
While there is evidence to suggest the junction was dangerous, there is a case for saying that other locations were as, or more, deserving of attention, especially if area and cost were taken into account.
The figures for all casualties in Pontefract between 1992 and 1994 were placed on a spreadsheet; the co-ordinates sorted and summarised
| Place | Bounded by gridlines | Area | Nature | Approximate Cost | |||||||||||||||||||||||||||||||||||||||||||||||||||||||||||||||||||||||||||||||||||||||||||||||
|---|---|---|---|---|---|---|---|---|---|---|---|---|---|---|---|---|---|---|---|---|---|---|---|---|---|---|---|---|---|---|---|---|---|---|---|---|---|---|---|---|---|---|---|---|---|---|---|---|---|---|---|---|---|---|---|---|---|---|---|---|---|---|---|---|---|---|---|---|---|---|---|---|---|---|---|---|---|---|---|---|---|---|---|---|---|---|---|---|---|---|---|---|---|---|---|---|---|---|---|
| West | East | South | North | m2 | Slight | Serious | �s | �/m2
| Town End | 530 | 550 | 150 | 170 | 40,000 | 20 | 1 | 300,000 | 8
| Halfpenny Lane/Front Street | 522 | 530 | 190 | 193 | 2,400 | 14 | 3 | 440,000 | 183
| Mayors Walk/Mill Hill | 543 | 550 | 82 | 83 | 700 | 4 | | 40,000 | 57
| Southgate/Friarwood | 583 | 589 | 195 | 199 | 2,400 | 8 | 1 | 180,000 | 75
| Southgate/Broad Lane | 574 | 577 | 186 | 189 | 900 | 6 | 1 | 160,000 | 178
| Southgate/Valley Road | 553 | 560 | 176 | 185 | 6,300 | 13 | | 130,000 | 21
| Holmes printers | 550 | 570 | 180 | 200 | 40,000 | 17 | 2 | 370,000 | 9
| Catholic Club | 510 | 530 | 190 | 200 | 20,000 | 16 | 5 | 660,000 | 33
| Table 4: Accidents at locations in Pontefract 1992-1994
| | ||||||||||
It is difficult to justify location. With Town End, for example, a portion is actually built up, and the accountancy offices at Ropergate End are an unlikely scene for pile up. Nevertheless, with a view to consistency, the defined area of Town End was used bearing in mind that of the samples shown, Town End has a high proportion of roads to non-roads, we can imagine a corrleation of Town End's casualty rate relative to the other locations. For the sake of interest the last two areas were chosen, one the same size and one half the size of Town End. Allthough these areas contain two or more junctions, they are equally worthy of consideration to Town End (Which in effect has 6).
Relative to other 'Hot Spots' Town End covers a huge area. In terms of its area it had the lowest casualty cost of the sites observed. It can be seen that in these years the area centered upon the Catholic Club (Halfpenny Lane, Front Street, Jubilee Way), had the same amount as casualties as Town End, in half the area, at twice the cost. It is sad to observe that in 1996 a child cyclist lost her life at the Halfpenny Lane/Front street junction.
Naturally, any road needs safety measures to minimise risk, but it might be suggested there was at least one more site in Pontefract where re-structuring should have been prioritised.
The general public do not like the traffic lights.
Since the installation of the traffic lights there has been much debate about the merits of them. The local newspaper has carried items, and letters, broadly supporting the view that their installation has been to the detriment of the town (see page 12). One objector even 'renamed' the roundabouts as a criticism of them.
As admitted by the paper, this might not give an accurate representation of the public's views so a survey was carried out. 50 people picked at random, by standing at the end of an alley in the town centre and asking everyone who walked through it the questions. Not all people asked were willing to answer
| Question | Yes | No | % Yes | % No | N/A.
| Are you Male? | 27 | 23 | 54 | 46 |
| Are you happy with the arrangements at Town end? | 4 | 46 | 8 | 92 |
| Did you think the old arrangements were adequate? | 41 | 6 | 82 | 12 | 3
| Do you think journey times have improved? | 4 | 46 | 8 | 92 |
| Do you think safety has improved? | 16 | 18 | 32 | 36 | 16
| Do you drive? | 31 | 19 | 62 | 38 |
| Table 5: Public Opinion on Town End
| | ||||
At the end of each questionnaire, the interviewees were asked if they wished to make a brief comment. 23 volunteered opinions, listed below
| Cock Up
Got worse Put it back Terrible Deceiving filter Improvement needed Road planners -Idiots Terrible Deceiving filter | Improvement needed
Road planners -Idiots Terrible Do Something Nightmare Rubbish Terrible for horses Go Back Not very good | Rubbish
To Many cars Go back Pretty poor Rubbish Worse now Go back to old way Put it back Taxi Drivers 'Crap' |
| Table 6: Public Opinion Comments about Town End | ||
|---|---|---|
It seems that it is not a small group of vociferous objectors alone who dislike the arrangements, but that this small group reflects a general discontent about the system.
In the light of the other figures in this paper, it is remarkable that 32% of interviewees thought safety had improved. It is encouraging to see that the Council's Public relations department is enjoying such profound success.
Yes, though highly unlikely
There are so many different ways to calculate chance and different starting figures to use. Of all aspects of this work this posed the thorniest problems. Apart from wondering how many casualties Pontefract would be expected to sustain, other variable factors might affect results, and results could be achieved using several different methods.
Mathematical models exist for calculate chance in different situations (Normal, Poisson, Binomial distributions to name but three).
An expert statistician might choose the appropriate model, nevertheless to the layman the process may seem complicated. With the three distribution models cited however, and for any other, the results will be broadly the same.
During 1993-5 Pontefract sustained 34 KSI casualties.
The national trend for KSI casualties for the three years after 1996 was a drop of 9%
We would have hoped Pontefract would follow the national trend in those years, and sustained 91% of 34 i.e. 31 KSI Casualties.
Pontefract in fact sustained 44 KSI casualties in the three years after 1996.
There is considerable development in housing on the Northeast edge of the town, but there is no significant influx of population or employment within the designated area. No schools have been built, and traffic calming measures in Willow Park, Carleton Park and elsewhere should have reduced casualties. Evidence of traffic being increased is not obvious.
We have then, a significant rise in casualties. A 'Poisson' distribution, though not entirely appropriate in this case nevertheless shows how if we have an expected mean of 31 random events in a given time what the chances are of having any other given number in a similar period. It can be calculated, using such a distribution, that if we had an expected mean of 31 events the chances of having 44 or more were 1.06%. Where the number of events exceeds 40, the chances become significantly small.
As stated, this model is not precisely appropriate for the Town End casualty situation. It is, however, one example of many distributions which lead to the conclusion that Pontefract is either very unfortunate, or something is going wrong. There is a case for stating that the rise in traffic casualties in Pontefract might be attributable to chance alone, nevertheless, we would expect a drop in casualties over the next few years if that were the case. We should be concerned that we would still be in the 'unluckiest' few percent.
After eleven years nothing has been done, no satisfactory answers have been given by members or officers of Wakefield Met, Pontefract is jammed up practically all day and people still hate the lights
The local Newspapers and Radio Station picked up on the story and the author presented the paper to the local community forum, the health board and transport scrutiny panel. The local engineering department and council members have been given copies of the paper and so far the latter have asked the former for a detailed explanation. A 'confidential' reply was sent by local engineers, but it was of a totally unsatisfactory nature (although it did admit to a rise in accidents at Town End)
Anecdotally, it was found while conducting the survey, that some people are naturally reluctant to answer questions in the street. Occasionally one would ask about the subject before committing themselves. Invariably the mention of Town End roundabouts would spark their rabid enthusiasm.
After Newspaper and Radio coverage many people have approached the author with praise and support. At the beginning of April notices were placed all around Town End saying WMDC were going to restructure the roundabouts, apoligising for any inconvenience, and bringing a wry smile to the face of many a driver who then read the start date - April 1st 2000.
But it's not that funny, is it?
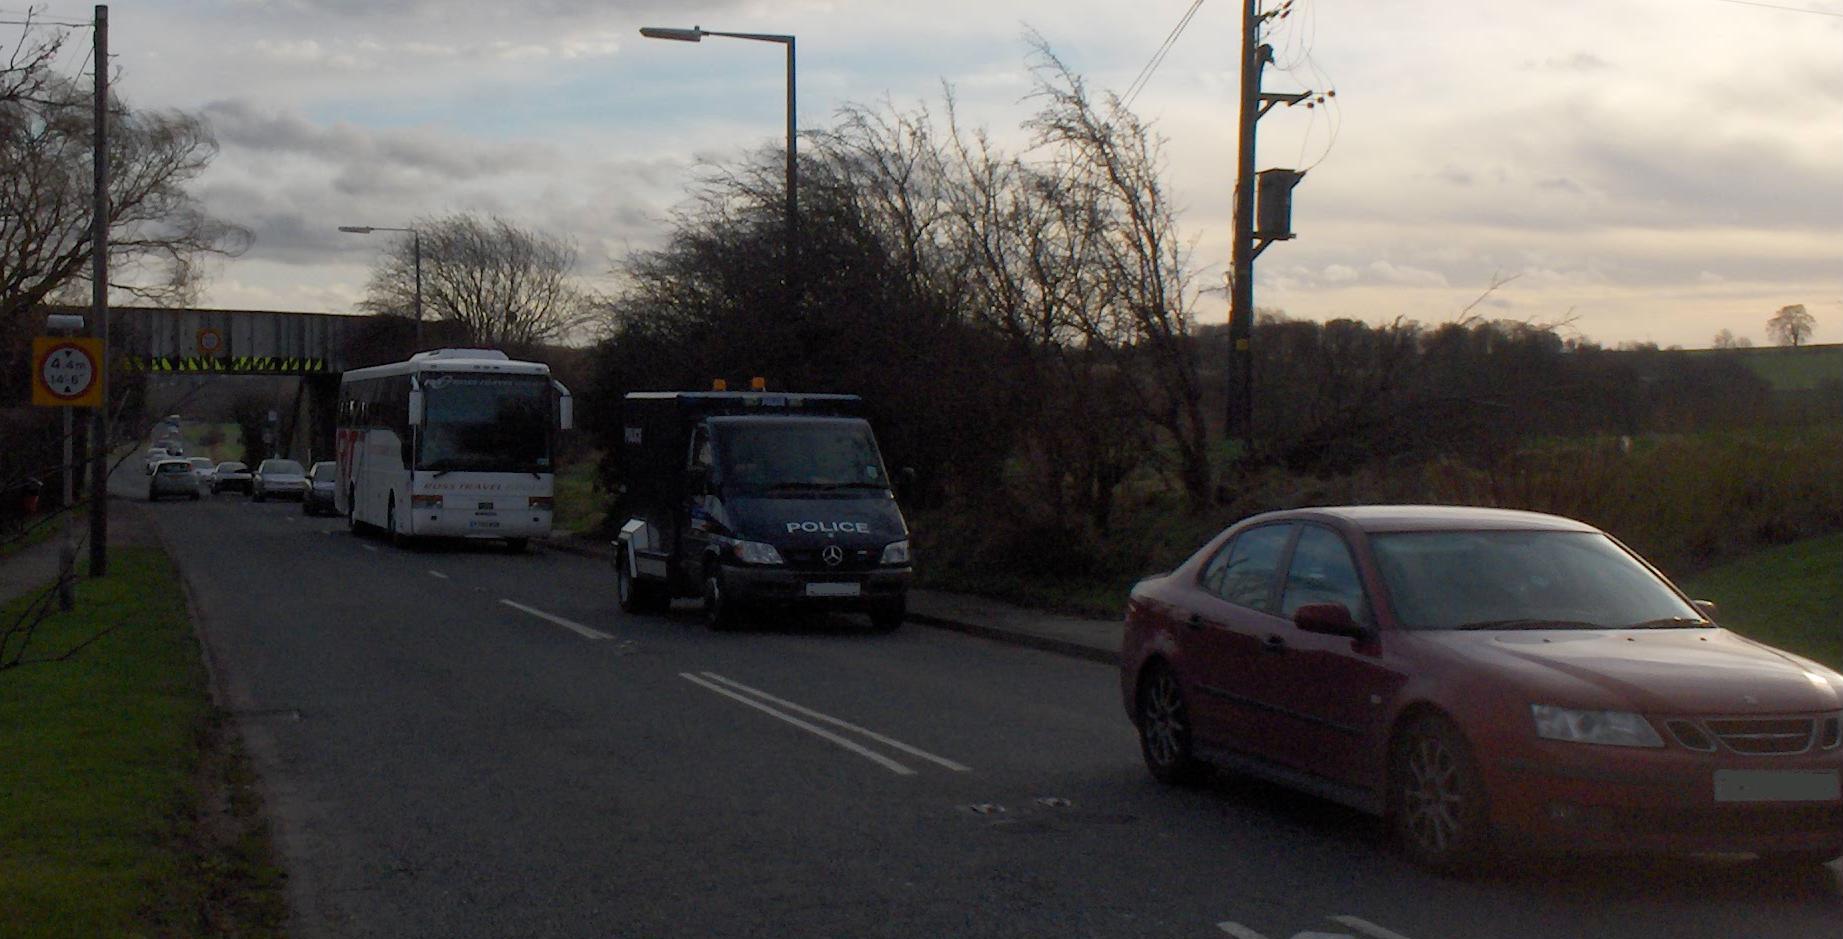 Fig 2: Hardwick Road Bridge, Pontefract, about 2 P.M. on Friday, 12th January 2007, over a mile away from Town End
This project is based figures obtained from the West Yorkshire Accident Database and the DETR Road 'Accident' reports. They are the figures relied upon by all agencies. I have endeavoured to utilise the biggest samples available, so have, whenever possible used several years' statistics. Specifically I have complete figures for Pontefract from 1992 to 1999 inclusive and all national figures up to and including 1998.
This observation of people's health, as a result of Motor traffic in Pontefract will underestimate the scale of damage. The following statements though true, are not accounted for.
The DETR estimates. (From page 34 of 'Road accidents Great Britain: 1997 the casualty report')
'About 36% of all road casualties were not reported to the police'
'In addition a fifth of casualties reported to the police went unrecorded'
'Police are more likely to underestimate severity of injury'
'Reporting rates are higher for less vulnerable road user groups'
The Government estimates. (In it's white paper on the future of transport, July 1998, Page 23)
'Up to 24,000 vulnerable people are estimated to die prematurely each year, and similar numbers are admitted to hospital, because of exposure to air pollution, much of which is due to road traffic'.
The Department of Health states. (In the 'Quantification of the effects of Air Pollution on Health in the United Kingdom' 1998, pages 58 and 59)
'There was too little information for determining an effect of Carbon Monoxide on either hospital admissions of mortality'
'We may have understated the overall effects of Air Pollution on health in the UK'
The net result of these statements might lead one to suppose that the casualties sustained in road impacts are only the tip of the iceberg when it comes to suffering caused by motor vehicles. It does not take a great leap of imagination to stand amidst the cars at Town End and realise that they might be doing considerable pollution damage. If the government estimates are correct, (And they admittedly err on the side of caution) we could extrapolate that for every Road death by 'accident' (Of which there are about 3,500 per year), there maybe six premature deaths by pollution (of which there may be 24,000).
Just as there are proportionate numbers of serious and slight injuries to deaths from RC's, likewise we can suppose for every death brought about by pollution there is a corresponding amount of non-fatal suffering. The department of health summarises In the 'Quantification of the effects of Air Pollution on Health in the United Kingdom' 1998, pages 57 & 58, '"There is no threshold of effect of particles or SO2 for either mortality or hospital admissions."
With 'accidents' the ratio of slight casualties to serious is approximately 10:1, and similarly serious to fatal 10:1. Considering the above statement it might be expected that increased pollution levels have a significant effect on peoples health, with ratios of degree at least the same as those for casualties. At this moment in time no studies have been carried out at Town End and the levels of pollution, nevertheless, the waiting time for all users and the idling time of motor cars at the junction has increased. � It is logical to assume an increased health risk for all users
The area surveyed is by no means comprehensive. Traffic will now divert through the outlying areas of Pontefract, and no figures have been established for Featherstone, East Hardwick, Darrington, the A1 or the M62. It is logical to suppose that the Town End restructuring increased traffic through and along these places. Within Pontefract itself, some parts of the periphery have not been accounted, and again, anecdotal evidence would suggest that these roads are now busier, therefore more dangerous. In all aspects of this report the detrimental effects to safety which might be attributable to Town End Lights either accurate or under-estimated.
Are usually based on those stipulated by the DETR, unless otherwise stated. The first definition, 'accident', is one in which is difficult to accept the DETR's euphemistic interpretation. The DETR themselves are reviewing their use of the term, as it's use in the context they define is at odds with the normal understanding, and is open to a very different legal interpretation. I have placed inverted commas around the word accident in DETR usage, included the Oxford definition, and have used the abbreviation RC for Road Casualty.
Accident: "Involves personal injury occurring on the public highway (including footways) in which at least one road vehicle or a vehicle in collision with a pedestrian is involved and which becomes known to the police within 30 days of it's occurrence. The vehicle need not be moving and accidents involving stationary vehicles and pedestrians or users are included. One 'accident' might give rise to several casualties. Damage only accidents are not included (In this publication)."
Accident: "Event that is without apparent cause or unexpected." (The Concise Oxford dictionary)
Built-up road: Road with, normally, 40mph or less speed limit.
Casualty: "A Person killed or injured in an 'accident'. Casualties are subdivided into killed, seriously injured and slightly injured."
DETR: Department of Transport, Environment and the Regions
Killed: "Human casualties who sustained injuries which caused death less than 30 days after the 'accident'."
KSI: Killed or seriously injured
Pontefract: An Area of 9 square kilometres, bounded by Ordnance survey gridlines 444 to 447 (west east) and 420 to 423 (south north). (see map below)

RC: Road casualty.
Serious injury: "An injury for which a person is detained in hospital as an 'in patient', or any of the following: Fractures, Concussion, Internal injuries, crushings, severe cuts and lacerations, severe shock requiring medical treatment and injuries causing death 30 or more days after the 'accident'. An injured casualty is recorded as seriously or slightly injured by the police on the basis of information available within a short time of the 'accident'. This generally will not reflect the results of a medical examination but may be influenced according to weather the casualty is hospitalised or not. Hospitalisation procedures vary regionally."
Slight injury: "An injury of a minor character such as a sprain, bruise or cut which are not judged to be severe, or slight shock requiring roadside attention. This definition includes injuries not requiring medical treatment.
Town End: For the purposes of this paper: The junction of the A645 and A639, The junction of 'Ropergate' (A one-way street emerging north of the main junction) with the A639, all pelican crossings, and about 30 meters from these pelican crossings in any direction. Bounded by grid lines (44)530 & (44)550 (west-east and (42)150 & (42)170 (south - north )
Maddison, D. et Al: The Trie costs of Road Transport 1999 (Earthscan)
Road Accidents Great Britain: 1997 the Casualty Report (DETR)
Ordnance survey
West Yorkshire Met Accident Database, Sweet Street, Leeds.
White Paper on transport, July 1998. (DETR)
The people of Pontefract
Quantification of the effects of Air Pollution in UK. (Dep. Health)
Chris Genn and Jean Siakeu, WY Accident database, Sweet Street, Leeds
Mick Griffin
Peter Hemming, Wakefield road safety
Wakefield College and staff.
My Diary thing about this project/campaign is available at Town End Diary