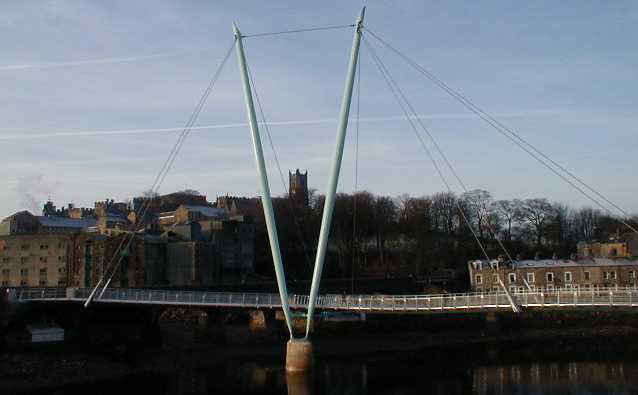
Box 1: The Millennium Bridge, Lancaster. (Dow, 2002)
This was my dissertation supervised by Mathew Page
Geography and Transport Planning BA Leeds University Dissertation
30th April 2003
This paper aims to offer a cheap and simple framework for the appraisal of low cost, low technology transport schemes, typified by a foot and cycle bridge across a railway joining a school with a housing estate which forms part of this study. The research will address the dichotomy of current appraisal techniques that load a disproportionate financial burden on small schemes and suggest a quantification of the benefits of walking and cycling that facilitates appraisal of such schemes. This will enable comparisons to be made with larger schemes. This study indicates that the benefit:cost ratio of such 'small' schemes is measurably and significantly greater than that of road building.
Keywords: Transport; Pedestrian; Walk; Bicycle; Appraisal
Large scale engineering has not appeared to reduce travel time (Potter, 1995 p.5) or brought about a broad improvement in quality of life (UK Government, 2001). Negative aspects of increased motor transport use are understood, with pollution (Glaister et al, 1998), accidents (DfT 2001), congestion (Pearce et al, 1993), ill health (WHO, 2001), noise (Nijland and Van Kempen, 2003) and urban sprawl (Aguiléra and Mignot, 2002) being amongst the most obvious. Referring to road building Goodwin et al (1991) tell us "We cannot build to fulfil unrestrained demand", yet as this British Labour government approaches perhaps a third term of office, the promises it gave of "far fewer journeys by car" (Prescott, 1999) and "the days of 'predict and provide' being over" in its White Paper (DETR, 1998a) have been reversed, with traffic increasing by record amounts and multi-million pound road and air schemes either in motion or under review.
Along with the realisation of the shortcomings of an engineering based 'predict and provide' approach, there has arisen a considerable body of literature dealing with the growing inefficiencies of the extant transport system. Apart from those endorsing further expansion, solutions to transport problems can be broadly divided into
In an effort to encourage integrated transport planning, each local authority in the UK has a statutory duty under the Transport Bill (Great Britain, 1999) to produce a Local Transport Plan (LTP). The most desirable modes of transport are indicated by being placed at the top of a hierarchy of users and, invariably, walking and cycling, along with disabled users, occupy the highest places on this list (e.g. WYLTP, 2000 p.19). Much other literature has been published endorsing walking and cycling as viable transport options; some statutory such as The Road Traffic Act (Great Britain, 1991), much guidance like the that for Full Local Transport Plans (DETR, 2000), some, as those mentioned, 'official' and much produced by non-governmental organisations such as Sustrans (2003), CPRE (2003), Living Streets (2003) and the CTC (2003). The evidence outlining the benefits of walking and cycling is strong but it is important to review the more salient aspects. A general ordered list of some of the benefits of soft modes might include:-
Given the potential of cycling and walking to bring about net social benefits, we see a trend of cumulative improvements by promoting them. The more that people walk and cycle, the more opportunities for (other) people to walk and cycle. All the above benefits encourage mutual growth, inducing a 'virtuous circle' of fiscally beneficial and environmentally neutral travel behaviour.
These benefits are broadly endorsed at all levels of government. The following list indicates a portion of the official literature dealing with walking and cycling as transport options. Much of the guidance stresses the desirability of these two modes. Taken individually, let alone en masse, they indicate a comprehensive requirement for walking and cycling provision. National guidance includes:
Guidance on Full Local Transport Plans (DETR, 2000):
At the core of Modern Transport planning in the UK are the 'Local Transport Plans' (LTPs). A statutory duty has been placed upon local authorities to produce these documents, with a view to achieving three broad outcomes, namely:
West Yorkshire Local Transport Plan (2000), which mentions the needs to:
In addition to the theoretical studies and advice concerning walking and cycling provision, we have examples where provision has been provided, thereby offering some form of model as to the potential of such schemes to realise those predicted benefits.
On reviewing some of the existing examples of foot and cycle routes there is a visible thread of consistency in that soft routes are popular and well used, even if they do not always provide a 'short-cut'. There have been, considering the large body of evidence endorsing such projects, few examples in the United Kingdom of the creation of short-cuts through authority intervention. Two of the three British examples herein are relatively large schemes to the one imagined at the study site, incorporating high-tech prestige projects costing millions, rather than thousands of pounds. These might give some indication as to the viability of similar schemes:
Box 1: The Millennium Bridge, Lancaster. (Dow, 2002)
The river Lune at Lancaster had three bridges up to the opening of Lancaster's Millennium bridge for cyclists and pedestrians. The bridge (Box 1) runs parallel and close to one of the main bridges, so does not provide large time savings, nevertheless, according to figures published by the local authority (Lancaster, 2002) 3000 people now use the it every day and "over 500 people use the bridge during the morning peak period (nearly half of all the cyclists and pedestrians who cross the river in the morning)". "The survey also showed a 16% increase in the total number of cyclists and pedestrians crossing the river at that time"
Given that, in the short run, this increase in desired travel modes is actually comprised of people shifting from private motor vehicle and public transport, we might speculate on a decrease in congestion elsewhere in the city.
The scheme, despite cost and time overruns, engineering difficulties and some initial objections appears to be a resounding success, but no costs were quoted.
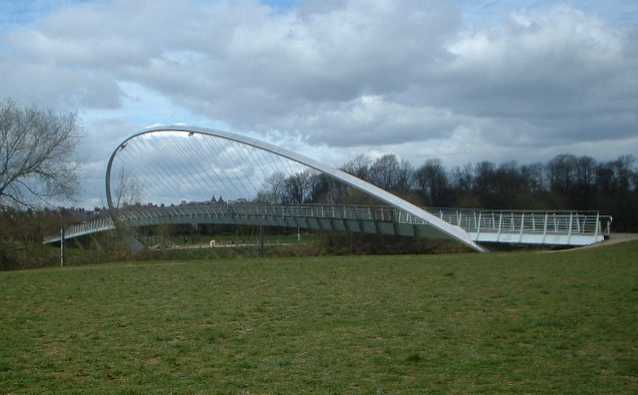
Box 2: The Millennium Bridge, York. (Author, 2003)
Completed in 2001 at a cost of Ż1.2 million as part of a Ż4.2 million project (Structurae, 2003), the River Ouse at York was spanned by 'Milly's Bridge' (Box 2) to the south of the city centre. Figures given in research by Andrew Booth (2002) indicate a 50/50 split between walkers and cyclists, with 2000 people per day using the bridge. A personal survey on April 1st 2003 broadly confirmed these figures, with exactly 50 walking and 50 cycling trips being performed in one hour in the early afternoon. When asked why they used the bridge, two respondents stated, although there were quicker routes for their trip, via the bridge was more pleasant. Single adjectives used by a variety of users to describe it included "Fantastic", "Modern", "Nice", "Useful" and "Awful" (The latter, a female cyclist, briefly expanded by saying "I have to come over it.").
Booth (2002) indicated that 25% of bridge users had previously used a more polluting form of transport, that 75% of users now completed their journeys faster, that participants in research had a willingness to pay for such schemes (Ż31.43 in the form of an increase in council tax) and even that they had made their home purchase deliberately in the vicinity of the bridge
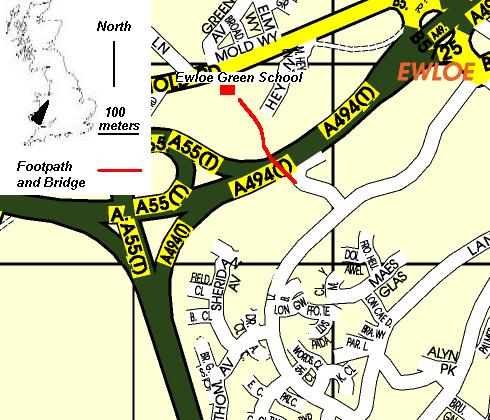
Box 3: Map of Ewloe Green School and Footbridge (Ordnance Survey, Streetmap, 2003)
The geographic scale (Box 3) of this particular 'safe route to school' is, perhaps significantly, similar to that of the proposed bridge (Box 4). In 2002 a path linking a primary school with a housing estate was upgraded, incorporating an existing bridge over the A494 Dual Carriageway. The path provides a short-cut of slightly less than 1 km, and is about 500 m from road to school. According to the headmaster, prior to the upgrade in excess of 80% of pupils were estimated to be driven to the school (N.B. there was still some form of path). Since the investment of Ż30,000 on surface and lighting 50% of the pupils now walk. It was pointed out that not just school pupils used it and that crime was "very very rare". Because the path serves the back of the school there is "very evident safety improvements" at the front of the school. It was observed that even parents who drove would now park on the south side of the dual carriageway in order to use the path.
By incorporating this theoretical and applied evidence, there emerges a general requirement for soft transport. There are academic, medical, legislative and logical reasons for catering for non-motor traffic endorsed unequivocally by actual applied practice, with little or no evidence to contradict those findings so far illustrated. Perhaps the very diversity of benefits brought about by soft transport, along with the wide spread of beneficiaries (from the ephemeral mayfly of time meeting the windscreen of destiny, to the entire world population) and the diffusion of those benefits both geographically and temporally, have served to dilute the perceptions of gains made from small schemes. Phil Goodwin (2003) illustrates that both advantages and disadvantages of walking schemes can be summarised in the same phrase "Walking projects are usually fairly cheap to do, provide benefits to a wide variety of people, without major new building".
The desirability of 'soft' transport schemes seems unanimous, nevertheless within the current framework of appraisal and implementation there appears to be a gap between the rhetoric and actuality. Analysis of transport schemes in NATA (DfT, 2001) discloses the framework around which transport schemes are justified. By adopting a broader view of costs and benefits than might have previously been accounted for, qualitative aspects of schemes may be described as part of the debit sheet, and greater emphasis is placed on temporal aspects. Recently the appraisal has been modified to incorporate costs and benefits over 30 years, reduction of discounting rates from 6% to 3.5%, and even included a factor for systematic over-optimism.
There is, however, no simple standard method of evaluating "short-cuts". With respect to this study, a perceived gap in the methodology was articulated in Local Transport Today (2002) when a headline read "NATA Inadequate for Walking and Cycling Assessment". A criticism levelled was that large schemes were over-valued and that NATA does not adequately measure the benefits of cycling and pedestrian routes. It was mooted that "appraisal of small schemes is often more expensive than the value of the schemes".
An accepted flaw of a standard cost-benefit analysis of any scheme is the difficulty in monetising costs, an acceptance of which is a major plank of NATA (DfT, 2001) which states "There may also be other significant costs and benefits, some of which cannot be presented in a monetised form. Where this is the case the analysis...should not be used as the sole basis of decisions". Qualitative judgement and scores are invited within NATA for many aspects of transport schemes.
Some of the qualitative evidence drawn from academic, professional, governmental, non-governmental, national, regional and local sources to indicate the viability of foot and cycle provision has been outlined. This paper is now concerned with the translation of costs and benefits into monetary values. While acknowledging the shortcomings of a strictly fiscal interpretation of value, the acceptance of cash as being an arbiter of value, however flawed, is nevertheless the optimum means of description at our disposal.
Instructions are given within NATA to simplify appraisal for smaller schemes, nevertheless they seem unsatisfactory, in that despite their many benefits, relatively little expenditure is devoted to them. If we take the NATA appraisal summary table (Table 1) and accept a degree of architectural sympathy we can establish that providing for walkers and cyclists has a positive impact on most of the rows
Table 1: Approximation of Appraisal Summary Table (DfT, 2001)for Foot and Cycle Routes
| Option |
| Description |
| OBJECTIVE | SUB-OBJECTIVE | QUALITATIVE IMPACTS |
| ENVIRONMENT | Noise | Positive |
| Local Air Quality | Positive | |
| Greenhouse Gases | Positive | |
| Landscape | Positive | |
| Townscape | Positive | |
| Heritage of Historic Resources | Positive | |
| Biodiversity | Positive |
| Water Environment | Positive | |
| Physical Fitness | Positive | |
| Journey Ambience | Positive | |
| SAFETY | Accidents | Positive |
| Security | Moot |
| ECONOMY | Public Accounts | Negative |
| Business Users and Providers | Positive |
| Consumer Users | Positive |
| Reliability | Positive | |
| Wider Economic Impacts | Positive | |
| ACCESSIBILITY | Option values | Positive |
| Severance | Positive | |
| Access to the Transport System | Positive | |
| INTEGRATION | Transport Interchange | Positive |
| Land-Use Policy | Positive |
| Other Government Policies | Positive |
This study will, for the sake of simplicity, accept all the positive aspects of well designed and maintained short-cuts, but only account for:
To maintain simplicity only pedestrian, cycle, bus and car journeys will be regarded and a short-cut will only be appraised using this method if it contains no significant impedance to movement and no contact with motors along its length
The benefit:cost ratio now becomes
Health Benefits + Accident savings + Time Savings + Operating Costs Savings: Public Accounts Cost
It will be subsequently shown that security and maintenance costs may probably be ignored so the sum total of costs will be the price of purchase and building.
In dealing with the benefits, once again, reference may be made to the NATA appraisal forms (DfT, 2001) and an eclectic version is suggested, only accounting for transport users who use the short-cut. It is unlikely that provision of a walking and cycling route would induce motor journeys and we have seen from the extant examples above that the reverse happens, nevertheless all gains to the economic efficiency of motor transport will be ignored other than those brought about to the individual through mode change as, even though broader social gains may be great, they are speculative. As simplicity is of the essence, the three other forms that are described in NATA (DfT, 2001) will be regarded as follows:
"Public accounts" will not differentiate between local government and central government funding and will be described as the capital cost. Source of funding has no relevance to a cost benefit analysis.
"Analysis of Monetised Costs and benefits" will be ignored as the intention is to reduce all aspects to cash figures only.
"Economic efficiency of the transport system" will be described purely as consumer user benefits of safety, time, health and operation savings.
The NATA appraisal can now be substituted by a spreadsheet (Table 2) containing 20 fields, six of which may be ignored and the remaining fourteen a product of distance and field coefficient with some given constraints (for maximum health benefits).
Table 2: Benefits (pence/kilometer unless stated) of short-cut:
| Pedestrian | Cyclist | Ex Motor users | |||
| Pedestrian | Cycle | ||||
| Safety 1 | |||||
| Distance saved | 13.44 | 16.58 | 1.04 | 1.04 | |
| Distance of short-cut | 13.44 | 16.58 | 1.04 | 1.04 | |
| Time 2 per km of distance saved | 246.15 | 101.05 | - | - | |
| Health 3 to 1.24p maximum | - | - | 1.27 | 51 | |
| Operating Costs 4 per km of original trip | - | - | 17.38 | 17.38 | |
These figures are taken from ongoing research by the author (2003), are all calculated at year 2001 prices and are explained as follows:
1 Safety savings consist of two parts. The first is product of the average value of prevention of a casualty (DfT, 1997), the risk of accident per kilometer by mode (DETR, 1998b) and the distance saved. A zero safety cost for the short-cut is accepted as we know that, although cyclists do form an impact risk to themselves and pedestrians, they are largely self eliminating and statistically insignificant. To put this in perspective in 1997 there were six fatalities in the UK involving pedestrian and/or cycle only accidents of which only two were on pavements (DETR 1998). The risk of injury to cyclists and walkers without motors is hardly worse than that from bee stings (Mosbech 1983). It is ventured, that once the pedestrian or cyclist has been segregated from motor traffic no significant safety costs remain other than those approximating to living, therefore the second portion of safety benefits is the product of risk and the length of short-cut.
2 Time savings are a product of those values given by the DfT as standard appraisal values for non-working time accounting for inflation at 2% per annum. (Car and bus time is given at Ż4.80 per hour, and double that for cycling and walking (DfT 1998b) and average speed of school journeys as indicated in figures (obtained by email) from the DfT derived from the national travel survey (They are: walking 3.5 km per hour, cycling 2.4 kph, bus 16.9 kph, and car 23.1 kph). It might be interesting to speculate on the actual value of time walking on a dedicated footpath. We see that at Elowe Green School (above) a significant modal change to walking which might not be bought about purely by time savings. If the value of time walking on the path was valued less severely then time in a motor car, this may be a contributory factor to modal shift. We are given average school trip speeds in a car as being approximately six times faster than walking, so it appears that no significant time saving can be made using the path, yet many more people use it. This might indicate an awareness of the participants of the health benefits of walking, an unusually high level of public spiritedness, unusually high traffic congestion, less 'fuss' at the end points and/or a superior time value on the path. It is probably some combination of all five. It is logical to assume that by having chosen a slower mode, the travel time cost has certainly not risen for the user, and that by moving from a congested and or busy route to one which has little or no external danger, noise or visual intrusion, travel time costs per unit of time are reduced, even if there has been no mode change. Further research by Wardman (1997) illustrates a variety of interpretations of value of travel time. Because of the above car trips which convert to walking are regarded as neutral in terms of time saving costs
3 Health Benefits: There is a broad consensus that maximum health benefits are gained by about 30 minutes of vigorous exercise (eg brisk walking or cycling), accumulated in short bouts, per day (Hanson et al 2001), (Erikssen et al 1998), (WHO 2000), (US Surgeon General, 1996). As the walking and cycling portion of a population would very likely have achieved the level of health recommended by the BMA (1993), for the sake of simplicity, this appraisal will ignore health benefits that might pertain to them. Using a life expectancy calculator, such as MSN (2003) we see that all other things being equal, a person who "Takes moderate exercise, such as walking at least two miles three times a week" will, on average, probably, live three years longer than a person who "avoids all physical exertion". Given a GDP of an individual of Ż15,000 per annum (CIA, 2003), It has been calculated by the author (Kidd, 2003) that, given the 3 years extra life bought about by exercise, and an average life expectancy of 78, the consequent value of regular exercise is Ż12.40 per week.
This is a conservative estimate of health values of exercise. No account is taken of quality of life benefits yet we know life is more fun if one can run faster and longer and enjoy the multiplicity of benefits associated with general good health. No credit is given to the effects of more regular aerobic exercise which, according to MSN (2003), increases life expectancy by a year. It is known that a sedentary lifestyle detrimentally affects levels of blood pressure, weight and cholesterol which, if excessive, are predicted to reduce life by at least seven years, yet this study ignores them. No account is made of disability affected life years which increase with lack of exercise though healthy people are productive for longer, and poorly for less.
This study will accept the conservative estimate, that the first ten quarter of an hour bouts of exercise per week are worth about one tenth of the Ż12ū 40 weekly benefits. It seems obvious that a school trip might be categorised as one of these bouts. For the want of more accurate data this paper will debit the first 15 minutes of each trip walking or cycling instead of driving at Ż1ū 24 in health benefits.
4 Operating costs are for an average car and are calculated at 17.38 pence per kilometer, being the sum of petrol and running costs (DfT 1998c)(while ignoring capital expenditure such as VED and Insurance). Operating costs for a bus may be expressed in terms of the fare paid. Bus companies operate very different fare structures, nevertheless it is reasonable that they broadly correlate to the marginal costs of car use, as borne out by the fare structure of First Direct Buses (2003).
Any appraisal concerning investment should set out to prove value greater than that investment, so, while conceding that many benefits are not accounted for in this methodology, their omission will lead to a systematic conservatism of benefits of short cuts.
Now this study will explore the feasibility of building a foot/cycle bridge (foot bridge) which will provide a 'short-cut' between a residential area and a large school. The research is intended to have a short term application in performing an appraisal specific to the study site, i.e. establishing if the site in question is a suitable location for a foot bridge.
On a broader scale it will offer an applied example of the relatively cheap and simple methodological appraisal framework outlined so far, for the assessment of a short-cut which might be applied to any route targeted at non-motor users. By using a modus operandi that estimates travel numbers, then calculating the costs and benefits, it will illustrate how the approach can be replicated in other situations for other similar low technology schemes incorporating soft transport modes.
Ostensibly this fieldwork explores a given number of (vital school) journeys made between points either side of an imaginary bridge. The bridge would shorten and, perhaps, enhance many journeys and, in addition, it might induce some modal shift, i.e. encourage people to walk and cycle when they are would normally use a car or bus.
Pertinently, there is a particular long-term imperative in promoting cycling and walking to the young, specifically to schools and colleges. We have, in general, the burden of a transport planning culture which is 'reluctant to embrace change' (Poinsatte and Tour, 2001). Balsas (2003) illustrated that given the open mindedness of students and the context of education, there is potential to motivate a willingness for change not prevalent in the community at large and by addressing the legislators of the future a greater good may be induced.
South Pontefract: OS Landranger Map 105. Grid Reference 445900 420700
Pontefract is a town of 32,000, in West Yorkshire, United Kingdom. In Pontefract, as within many other places, transport infrastructure, both road and rail, isolates some areas of the town from one another. This naturally leads to long journeys being made to travel relatively short distances and/or lack of access between sites in close proximity. Not untypically for any town it may be conjectured that the provision of walking and cycling routes would provide social benefits exceeding costs.
In 1997 a route, 'The Pontefract Way' (Kidd, 1998) was identified, much of it extant, which could provide safe walking and cycling routes between 11 schools and considerable swathes of housing, as well as facilitating access to recreational, industrial and retail space. The proposed route involved two new railway crossings and it is with one of these that this study is concerned.
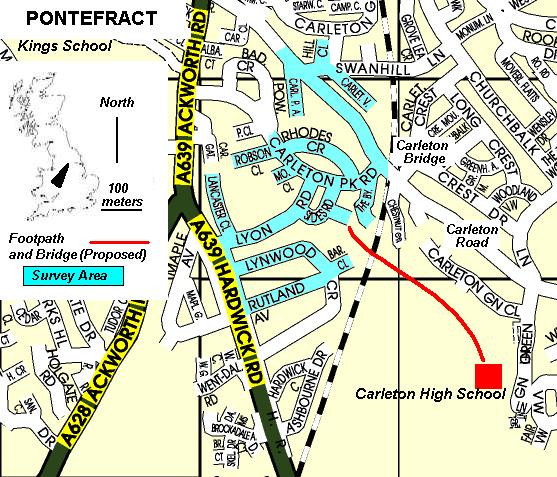
Box 4: Map of South Pontefract and Footbridge (Ordnance Survey, Streetmap 2003)
At the location as shown in Box (4) a bridge would span a shallow railway cutting, joining a large housing estate (Carleton Park) to the west and a secondary school (Carleton High) to the east.
The bridge site in question is currently inaccessible from either side, but can be seen to the east from the school playing fields (with permission) , and to the west via a small park nestled at the end of a cull de sac. The park is often locked (on four occasions out five daytime visits during 2003).
It is notable that in 2001 high, robust fencing was built between the park and the railway lines, as up to this time the route had been used as a short-cut by pupils attending the school (crossing the railway line on foot). No figures are available to indicate how many people crossed the line illegally but, although not exactly conducive to trespass, a path was worn through the embankment undergrowth, and the fences regularly broken, indicating regular use and some demand for a footbridge.
1065 pupils attend the school (April 2003) of which very few cycle, with the vast majority either being driven, walking or using the bus.
At a local level the bridge would basically offer many residents, especially students, an opportunity to make time savings on their journeys. There are other groups, such as those doing night classes, ramblers, general recreational users, and residents from the east of the railway line using a pub and post office to the west, who would be presented with a viable and pleasant alternative to journeys which they may now drive upon. Two junior and infants' schools might also directly benefit from the bridge as, although the railway line largely forms a boundary to the catchment areas of each of them, there is currently some overlap. For these pupils the bridge might offer a safe route to school, specifically those whose only option is using a long stretch of Carleton Road and are currently driven.
Gains would be made by those residents from the survey area, Carleton Park, some of whom could turn a 1.5 kilometre journey into one of less than 500 meters, an inconvenient and dangerous school trip into one that could be enjoyable and safe.
The values a bridge would present in the context of a complete recreational and utilitarian route around the town (i.e. part of 'The Pontefract Way' network) might be very much greater, but more difficult to quantify. For the purposes of this thesis those benefits accruing to the immediate vicinity of the bridge, specifically to school users will be largely concentrated upon.
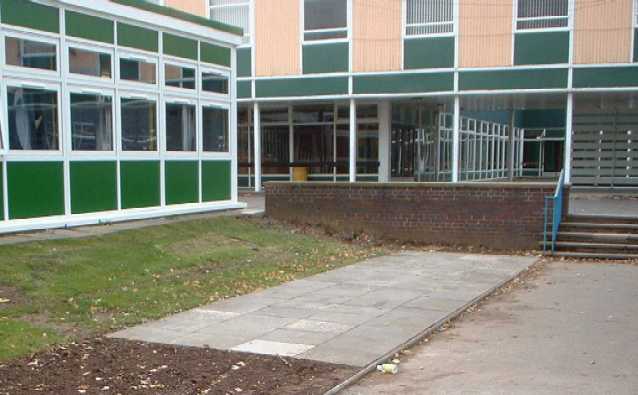
Box 5. Carleton High School Cycle Parking (author)
Further investigation of local requirement illustrates that, currently, very few pupils cycle to the school, as evidenced by box (5), an image of the cycle parking facilities on a not untypical school day in October 2002 (The cycle parking is the 52 paving stones in the foreground).
On being first welcomed to the school pupils are required to get a permit if they wish to cycle, and are told in writing that they must walk when within 200 metres of the school, as the single road to the school is busy with cars and buses. In 2002 Green Lane, the cull de sac which leads to the school was widened by building into the village green, in an attempt to reduce motor vehicle congestion at school times. In the same year extensive covered cycle parking was replaced by car parking at the school.
It appears that there is a deteriorating situation where very few people cycle, therefore nothing is done for cyclists, creating a feedback of negativity.
Carleton High School does not have a particularly remarkable demographic in that the majority of the pupils live locally. It might be imagined that, given figures regarding other schools in similar areas, there would be scope for increasing the number of journeys by bike, and perhaps on foot, were these options to be rendered more attractive. (Peterborough claims 10% of pupils cycle). A survey by Lord and Murray (2003) for Leeds City Council indicated that 46% of 11 to 14 year olds would like to cycle to school, and there is absolutely no evidence to suggest that people in Pontefract are particularly different from this aspect.
In 1998 when the proposals for such a bridge as part of path orbiting the town was first mooted, over 99% of over 2000 respondents agreed that the scheme was desirable from both a recreational and utilitarian perspective. There was broad agreement from the local medical and education professions (Kidd, 1998).
The school is a centre for night-classes in the area, with around 25 lessons being held every week, some of them for students from the Carleton Park area (one respondent indicated he attended night classes). Carleton east of the railway line has no shops or pubs, but to the west side is a chip shop, pub, off licence, garage and post office, distances to which would be reduced by a bridge.
Engineering costs should be simple to quantify, but it must be born in mind the natural bias towards consumptive spending. 'Safety' may impose considerable strain on such public schemes, and it might be imagined that were a footbridge going to 'luckily' save a life by taking the victim away from the road it would be very difficult to account. On the other hand if somebody slipped on a new public structure it might be imagined that there would be considerable cost potential. Whilst bearing this in mind the maximum cost will be considered, thus, if anything, weighting the study against provision of a bridge.
An emailed quote from Nu Steel Construction for the bridge constructed to guidelines embracing safety and disabled access stated the cost as being between "Ż270,000 and Ż300,000" In addition there would be some cost involved in disruption to rail and a build cost for infrastructure including 500m of pathway. 500m of 3 m wide cambered and metalled pathway was quoted from J. Smallman, a local contractor, at Ż50 per metre, which would bring the total cost up to Ż325,000.
Some maintenance costs would accrue, nevertheless it can be assumed that wear and tear would be displaced from another location, therefore be neutral. Maintenance, such as mowing, is carried out anyway, and the bridge and path would not incur surplus costs of this type.
The land is already owned and would be retained by the local authority, therefore no purchase of eatate would be required
There is a perceived cost of crime. Local residents, and teachers have all expressed disquiet about and acted on concerns about increased access offering potential for loitering and anti-social behaviour. Headmaster S. Brown of Carleton High School wrote "I can foresee considerable problems for those schools who would have a cycle track across part of their playing fields", echoing Head V.S. Kenningham of the King's school, Pontefract who wrote about paths: "I was not prepared to open up the site to allow cyclists free access through the school for safety and security reasons". Although it might be pointed out that people and especially car drivers have free access to these schools already, their concerns are nonetheless real, somewhat typical and, through their conviction, equivocate a vigorous argument which must be addressed. We see in the Ewloe Green example a school which through such provision has not suffered any significant crime costs, at least according to the headmaster. Research commissioned by Sustrans (Parker, 1998) illustrated three key findings:
Accepting zero additional maintenance costs and using the estimated building cost, the cost of the bridge is Ż325,000.
Three methods of studying travel patterns were considered. The optimal method, considering the bridge would mainly benefit school children, would probably be through the school, nevertheless the school was not approached. It was considered that an independent approach might yield the same data whilst revealing non-school journey aspects.
A second method might have been road side surveys. Although one was used to illustrate and confirm findings (Table 4), difficulties involved in approaching commuters restricted this method to passive observation only.
A household survey eventually formed the main body of evidence, the methodology for which is outlined below:
A letter described in box (6) and form (Box 7) were posted to 20% of the houses in the survey area, all in the catchment of the foot bridge, defined by the points at which the distance to the school via the proposed bridge was equal to the distance of the extant route (see box 4) and less than the straight distance to the King's School, to the north. Quite simply every house number ending with a two or a seven was targeted. the thrust of the letter said:
|
I would ask you to use your imagination to consider a bridge, built along with a hard, wide path between Sides Road and the School, via the swing park and playing fields, shown on the map, and fill in the questionnaire. In terms of distance, all journeys from the Pontefract side of the railway lines north of Rutland Avenue would be the same length or shorter by such a footbridge. |
The attatched questionaire formed the basis for the results, the important aspects of which were:
|
Name (optional)________________ Postcode__________________ Without Bridge (Now) How many trips were made during the last school week by household members to or from Carleton High School?
Approximately how many trips per week would be made if a bridge was in place? (there might be more or less)
Approximately how many of these trips would be made over the new bridge by household members?
|
The survey was carried out over four days in February 2003, and consisted of letters being posted on one day, and replies picked up the following day. As much time was spent discussing the form with the respondents as needed.
Of the 137 houses targeted, replies were obtained from 56. Of these 55 were received on the re-visit, but one respondent was kind enough to actually discover the author's address (which was not disclosed) and post a reply. Despite not seeing any personal use for the bridge this respondent wrote positively and at length about it.
Of the 56 replies five indicated a standard ten journeys per week, one indicated two journeys and one indicated 14. Of these journeys ten were by car, the rest were walked, and all the walkers predicted that they would use the bridge (walking) were it in place. The driver anticipated walking twice a week, but pointed out that walking had been their preferred choice when initially starting work at the school.
It can thus be seen that by multiplying the number of houses targeted (137) by five (as one in five houses were targeted) we had a survey area of about 685 houses. We might extrapolate, given the information collected and multiplying it by five in each case the following journeys between the survey area and the school (Table 3)
Table 3: Journeys between survey area and Carleton High School per week by mode
| Current | Predicted | ||
| Walk | Drive | Walk | Drive |
| 330 | 50 | 340 | 40 |
These results ran counter to intuition in that one might have expected more car journeys to be revealed. An observation on Carleton bridge on the morning of March 11th 2003 between 8:00 and 9:00 PM, revealed 96 accompanied Carleton High school trips over it by car, indicating a significant gap in the data collection. This might be a function of chance, or given the relatively close proximity of the survey area to the school, it is probable that journeys were originating outside the study area. The bridge survey did reveal 77 walking trips, indicating over double the amount surveyed, but this would be expected owing to the incompleteness of coverage of the survey area relative to the catchment area. 41 Carleton High school pupils were counted on a single bus.
From the bridge survey we can calculate the pupil related journeys to Carleton High School across it (Table 4). Each observation was multiplied by ten to reveal the weekly journeys, apart from the drivers, which were assumed to be making return journeys, therefore multiplied by 20. Whilst conceding that the driver journeys might be incorporated into larger ones, no evidence was discovered to indicate this and apart from Carleton High School, most facilities in Pontefract would demand a 'doubling back'.
Table 4: Pupil related journeys to or from Carleton High School crossing Carleton Bridge by mode
| Observed (Morning) | Predicted (Week) | |
| Car Drivers | 64 | 1280 |
| Car Passengers | 99 | 990 |
| Bus | 41 | 410 |
| Pedestrian | 76 | 760 |
| Bicycle | 2 | 20 |
| TOTAL | 3460 | |
Even without accounting for staff and visitor journeys we see that this is nine times greater than the 380 journeys emanating from the study area.
Naturally origins to the school journey are not exclusive to the study area, but it must be borne in mind that with only a partial survey (as performed) the chances of amassing a reliable data set decrease exponentially with distance from the school, borne out by table (4).
Some conclusions might be drawn from the data collected: Considering that many of these journeys in table 4 might be converted to shorter and/or non motorised ones were a bridge to be in place, we can safely assume that considering only the study area would bias an assessment against a bridge by a large factor.
None of the school journeys in the survey area were on or North of Carleton Road. This means that every user of the foot bridge, as surveyed, would have some time and distance benefits.
All those journeys discovered in the study area would save time. Of these journeys, if we accept 3.9 k/h as an average walking speed and an average saving of 250m we can calculate 21.15 hours of saved time per week. Given the DfT value of time of Ż9.60 per hour (1998c) we have a cash benefit equivalent, for those people who currently walk, of Ż203.04 per week.
By accepting, because of the low numbers involved, the value of safety to those current drivers who start to walk being statistically insignificant, the total safety benefits (at 13.5 p per km) are the sum of those pertaining to the walking distance saved plus those pertaining to the length of the 'short-cut'
Table 5: Safety Benefits per week of Foot bridge to Carleton High School
| Saved | On Total Journey | On Short-cut | Total Safety Benefits |
| Distance (m) | 375 | 500 | |
| No of Journeys | 330 | 330 | |
| In Total (km) | 123.75 | 165 | |
| In Total (Ż) | 16.71 | 22.28 | 39.98 |
It is calculated in table (5) that the proposed bridge would bring about a safety cost saving of Ż39.98 per week
The only evidence of mode change discovered through the survey was two journeys of one km, extrapolating to 10 kilometres of operating savings per week at 17.36 p per km, i.e. Ż1.74 per week.
We now have the following savings brought about by the bridge per week for the survey area, i.e. Time Ż203, safety Ż39.98, health Ż12.50 and operating Ż1.74 giving a combined total Ż256.16 per week.
It would, without economic machinations such as discounting and inflation, accepting school years of forty weeks, take over thirty years for the bridge to repay a Ż330,000 investment only if trips from the survey area are accounted for. The current rate of discounting (the amount by which future benefits are devalued to equate to present day values) is 3.5% per year for the first 30 years. Again with respect only to the survey area the Benefit Cost Ratio (BCR) of developing this particular short-cut is 0ū 77, i.e. the benefits do not exceed the costs, and even for want of competition which provides higher returns on investment the scheme fails.
Crucially, it is not unreasonable to suppose that, as the studied area considered only 10% of the journeys over Carleton Bridge, it has only revealed 10% of the benefits. Accepting the survey as being cross-sectionally representative, we see the potential for the bridge to recoup its cost in less than three years, such a short time scale that year on year discounting would have very little effect. Using the standard appraisal values of 3.5% discounting per year for 30 years we see a CBR of 7.71.
Throughout this work a precautionary principle has been used in totalling benefits. That uncounted benefits exist is beyond conjecture, nevertheless they have been omitted because of the complexity of valuing them, incorporating them into the appraisal method and because their incorporation is probably not necessary to prove the case for soft transport solutions. Were, however, an appraisal of a low cost scheme to result in a borderline decision as to value, then some of the omitted benefits might be incorporated, either through a quantitative interpretation of their value or a qualitative justification. In this case NATA headings might be addressed or even added to, by incorporating some of those benefits not directly addressed in NATA but included in those initially set out within this paper.
A summary of possible errors of negative bias that diminish the value of short-cuts in this evaluation includes:
1. Omission of upstream and downstream values as outlined in NATA Appraisal summary (Table 1);
2. Systematic over-optimism of road projects as indicated by Mackie and Preston (1998) along with costs of road building currently ignored in valuations, such as crime and contagion;
3. Reliability of discounting value of 3.5% (DfT, 2001). Until recently, the accepted value of 6% would have reflected the comparative benefits of soft schemes, which recoup their costs quickly, far more favourably;
4. Underestimate of modal change. It might be argued that only one car journey was discovered in the study to 16 pedestrians (Yet observed trips over Carleton bridge indicated a ratio of 4.5 non-pedestrian trips for each pedestrian) therefore the greatest benefits had not been revealed in that no accurate prediction could be made for a modal shift which the Ewloe Green and York examples would indicate was probable;
5. Underestimate of users. As no teacher journeys were revealed there appears to be a shortfall in the data. No trips of any kind other than to Carleton High school were revealed, although it is certain they would occur for different origins and destinations and other purposes, born out by the York survey which revealed 8 dogs per hour;
6. Non account of linkage. If the route were developed as part of a network it is certain that more journeys would become apparent because of it;
7. Underestimate in time savings. It is logical to assume that average walking and cycling times will be faster without crossing roads. It also appeared, given the applied examples that the negative cost of travel time varies greatly with quality of route;
8. Underestimate of health benefits. Only the narrowest of parameters were used to indicate a three year increase in life expectancy. If these had been expanded to incorporate health conditions, and broadened to incorporate physiological effects of sedentary lifestyle and added to those psychological and physiological benefits of rude health it is not unreasonable to consider they may have been underestimated by a factor of four or more (MSN 2003). Once again this error would probably be amplified by the underestimate in modal change outlined in (4) above and
9. Overestimate of costs. Only one commercial estimate for costs was supplied. Under tender it would be expected that lower capital costs could be achieved.
This study analysed a small, 'expensive', shortcut from an ordinary estate to an average school in an typical town. If the study was indicative of the population at large, the provision of this, perhaps unremarkable, short-cut would yield remarkable benefits seven times greater than the cost. This far exceeds any of those values revealed for motor road building or repair, an example of which, the nearby Ferrybridge to Hook Moor upgrade of the A1 yields a CBR of 3ū 7 (DETR, 1998) (under the COBA appraisal system now indicated to be biased to appraisal optimism).
Despite this evidence that walking and cycling schemes may provide very high returns on investment, there are at least two instances in Pontefract where the local authority has blocked existing adopted paths leading directly to schools, thereby forcing diversions to many school children (Mill Hill Avenue and Cobbler's Lane). The same authority, in 1996, spent at least Ż250,000 on road reconstruction near Pontefract town centre (Kidd, 1999) yielding no apparent social benefit but which has been followed by an increase in congestion and accidents. At the study site a considerable amount appears to have been spent on fencing, thereby impeding travel. The motives for such actions, especially in the light of this paper deserve further scrutiny.
It may be supposed that the kind of figures revealed herein could be replicated in many other locations. The speculation as to why walking and cycling schemes do not proliferate is a matter of interest to the general public and a matter for introspection for the treasury, DfT and local authorities.
Adams H. S. et al (1993) Assessment of road users' elemental carbon personal exposure levels, London, UK Atmospheric Environment Volume 36, Issue 34 , November 2002, pp 5335-5342
ADONIS (1998) Best practice to promote cycling and walking http://www.vd.dk/wimpprintdoccol.asp?page=document&objno=7134
Aguiléra, A. and Mignot, D. (2002) The structure of intra-urban locations and home-to-work travel. Recherche - Transports - Sécurité (Uncorrected proof)
Balas, C. (2003) Sustainable Transport planning on college campuses. Transport Policy 10 (2003) pp.35-49
BMA (British Medical Association) (1992) Cycling Towards Health and Safety. Oxford, Oxford University Press
Booth, A. (2002) With Reference to the Millennium Bridge in York to what level have Cyclist and pedestrian orientated sustainable transport investments been successful? MSc Dissertation, Environment Department, University of York
Bravo, G. et al (1987) Impact of a 12-month exercise program on the physical and psychological health of osteopenic women Maturitas Volume 26 Issue 2 pp 151,152
Câmara, P. (2000) The Health Benefits of Non-motorised Modes of Transport Carfree Times March 24 2000
CPRE (2003) The Campaign for the protection of rural England. http://www.cpre.org.uk
CIA (Central Intelligence Agency) (2002) World Fact Book. http://www.cia.gov/cia/publications/factbook/
COMEAP (Committee on the Medical Effects of Air Pollutants) (1998) The quantification of the effects of air pollution on health in the United Kingdom London, HMSO
CTC (2003) Cycling Touring and Campaigning. http://www.ctc.org.uk
Cykelby (2003) Denmark's Leading Cycling Lab - Odense the Cycling City http://www.cyclecity.dk/eng_leadingcyclinglab.asp
DETR (Department of Environment, Transport and the Regions) (1998a) A New Deal for Transport: Better for Everyone. Cm 3950. London, Stationary Office
DETR (Department of Environment, Transport and the Regions) (1998b) Road Accidents Great Britain: 1997 The casualty Report. London, Stationary Office
DETR (Department of Environment, Transport and the Regions) (2000) Guidance on Full Local Transport plan. London, Stationary Office
DfT (Department for Transport) (1997) Highways Economics Note No.1 1997 Benefits To Society Arising From Prevention Of Road Accidents And Casualties http://www.roads.dft.gov.uk/roadsafety/hen197/2.htm
DfT (Department for Transport) (1998a) A1 (M) Ferrybridge To Hook Moor - 1996 Scheme appraisal 27th July 1998 http://www.dft.gov.uk/itwp/appraisal/understanding/pdf/2.pdf
DfT (Department for Transport) (1998b) Highways Economics Note 2. Values of Time http://www.roads.dft.gov.uk/roadnetwork/heta/highway/04.htm
DfT (Department for Transport) (1998c) Highways Economics Note 3.Vehicle Operating Costs. http://www.roads.dft.gov.uk/roadnetwork/heta/highway/05.htm
DfT (Department for Transport) (2001) Applying the Multi-modal New Approach to Appraisal to Highway Schemes http://www.roads.dft.gov.uk/roadnetwork/heta/highway/06.htm
Di Lorenzo, T. et al (1999) Long-Term Effects of Aerobic Exercise on Psychological Outcomes. Preventative medicine 28 pp. 75-85
Dixon, M. (2002) The Millennium Bridge at Lancaster http://ourworld-top.cs.com/oliverMDixon/index.htm
Dow, Richard (2003). Photograph from Gregson Arts & Community Centre Millennium Bridge. http://www.gregson.co.uk/millenium_bridge.htm
First Direct Buses (2003) Telephone 01484 426313
Erikssen, G. et al (1998) Changes in Physical fitness and changes in Mortality The Lancet. Volume 252, September 5, 1998 pp. 759-762
Gateshead Photo from http://www.gateshead.gov.uk/bridge/nc5.htm
Glaister, Stephen et al. (1998) Transport Policy in Britain. London, Macmillan
Goodwin, P, et al (1991) Transport: The New Realism, Report to the Rees Jeffreys Road Fund, Transport Studies Unit, University of Oxford
Goodwin, P. (2003) Appraisal of walking Schemes Unpublished lecture overhead
Great Britain (1991) Road Traffic Act. London, HMSO
Great Britain (1999) Transport Bill Part II. London, HMSO
Hansen, C. et al (2001) Exercise Duration and Mood State: How much is enough to feel better? Health Psychology Volume 20, Issue 4, July 2001, pp. 267-275
Kidd, S. (1998) The Pontefract Way http://powa.20m.com
Kidd, S. (2000) The Town End Traffic Lights And Road Safety In Pontefract Access to Higher Education research project, Wakefield College. http://pontefract.20m.com/TownEnd.html
Kidd, S. (2003) The School Run and the Rationality of Driving. BA Research Paper, Department of Geography, University of Leeds
Krauss, et al (1987) Incidence, Severity and Outcomes of Brain Injuries Involving Bicycles American Journal of Public Health, 77 pp 76 - 78
Lancaster Council Lancaster Bridge Web page No longer available: was at http://www.lancaster.gov.uk/millennium/newbridg.htm
Living Streets (2003) http://www.pedestrians.org.uk
Local Transport Today, Anon (2002) NATA inadequate for walking and cycling Assessment Local Transport Today, February 14 2002, p.7
Lord, A. and Murray, S. (2003) Cycling - A Secondary Issue, Cycling In Leeds Secondary Schools Years 7,8 and 9.Leeds City Council. http://www.spokes.org.uk/leeds1.htm
Mackie, P. and Preston , J. (1998) Twenty -one sources of error and bias in transport project appraisal. Transport Policy 5 (1998) 1-7
MSN (Microsoft Money) (2003) Life Expectancy Calculator. http://moneycentral.msn.com/investor/calcs/n_expect/main.asp
Mosbech, H. (1983) Death caused by wasp and bee stings in Denmark 1960-1980. PubMed 1983 Apr; 38(3):195-200
National Cycling Strategy (2003) http://www.nationalcyclingstrategy.org.uk/
Nijland, H. and Van Kempen, J. (2003) Costs and benefits of noise abatement measures Transport Policy (Corrected Proof)
Ordnance Survey http://www.streetmap.co.uk
Parker, K. (1998) The Impact of the National cycle network on Surrounding Land Uses. PhD Research, University of the West of England
Pearce et al (1993) Measuring Sustainable Development. London, Earthscan
Peterborough City Council, Anon (2000) Peterborough Encourages Safer Journeys To School http://www.peterborough.gov.uk/news/pressreleases/2000-09/20000915002.html
Poinsatte, F. and Tour, W. (2001) Finding a New Way: Campus Transportation for the 21st century, 2nd Ed, Boulder, University of Colorado.
Potter, S. (1997) Vital Travel Statistics. London, Landor.
Prescott, J.(M.P.) (1999) Hansard 20 Dec 1999: Column 532. http://www.parliament.uk/index.cfm
Royal Commission on Environmental Pollution (1997) Transport and the Environment - Development Since 1994, 20th Report, HMSO.
Shay, K. and Roth, D. (1992) Association Between Aerobic Fitness and Visuospatial performance in Healthy Adults. Psychology and Ageing, 7(1), 15Ł24
Structurae (2003) York Millennium Bridge http://www.structurae.de/en/structures/data/str04802.php
Sustrans (2003) http://www.sustrans.org.uk
U.S. Department Of Health (1996) Physical Activity And Health, A Report Of The Surgeon General http://www.cdc.gov/nccdphp/sgr/sgr.htm
UK Government (2001) Regional quality of life counts: http://www.sustainable-development.gov.uk/indicators/headline/h6.htm
UTMC (Urban Traffic Management and Control) (2000) The Potential for incorporating the consideration of Bicycle traffic in Urban Traffic Management and Control systems UTMC 24 Copy 1 http://www.utmc.gov.uk/utmcr1/pdf/utmc24.pdf
Victorian Government (2000) The Active for life Physical activity Framework http://www.dhs.vic.gov.au/phd/activeforlife/downloads/pasframework.pdf
WHO (World Health Organisation) (2003) WHO Statistical Information System (WHOSIS) Evidence and Information for Health Policy http://www3.who.int/whosis/menu.cfm
WYLTP (West Yorkshire Local Transport Plan) (2000). Leeds, West Yorkshire Passenger Transport Executive